Every other week, we will be publishing labor market industry (LMI) data and important trends to consider in the development of an equitable economic recovery from the COVID-19 crisis. We are always looking for opportunities to learn, grow, and collaborate. Email wpsi@universitycity.org to learn more.
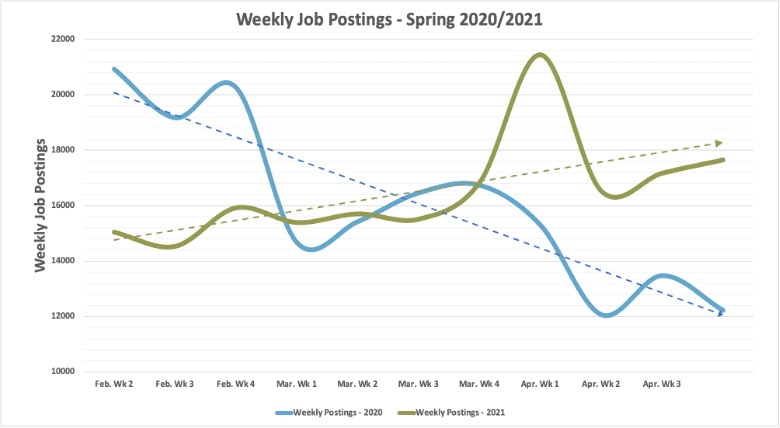
The labor market in Philadelphia has continued to show promise over the past weeks as we welcome spring, with a steady increase in weekly job postings. Thanks to more vaccinations, nice weather, and the relaxing of some restrictions, it appears that consumers are starting to feel safer venturing out to shops and restaurants, leading to an increase in demand for workers. Total job postings were around 30% higher the week ending on April 24th, 2021 compared to the same week in 2020, and forecasts anticipate continued demand for workers in the coming months.
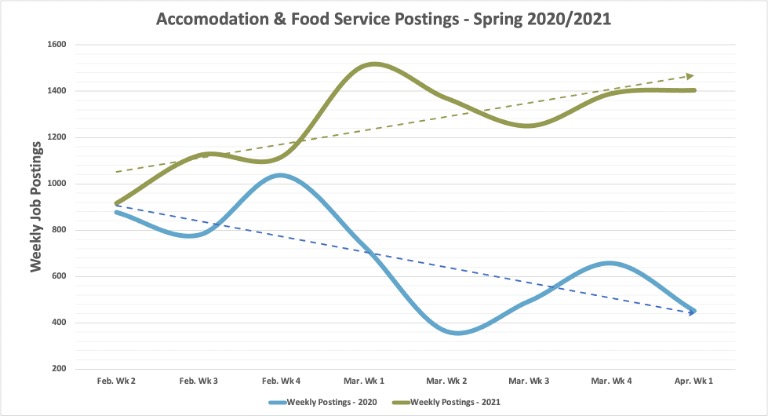
The rush to hire workers to fill this anticipated demand has led to a unique situation in the labor market. In the last few weeks, we’ve begun to hear stories that some of these jobs are going unfilled, and businesses are not able to find needed talent. In some cases, employers that are offering bonuses to new hires or higher pay grades are still struggling to staff up. Looking at the hospitality industry in the Philadelphia area, we can see that the number of weekly job postings is up over 3 times the level it was one year ago in the midst of the first wave of lockdowns. However, restaurants continue to report they cannot find enough talent to ramp up reopening efforts and meet demand.
There are a number of theories as to what is leading workers to decide to stay out of the labor market for the time being. First, it could be contributed to continued concerns about health and safety, especially for those who have not been vaccinated yet. Second, schools remain remote in many parts of the country, forcing parents or caretakers to remain at home to support their children throughout the day, potentially preventing them from working. Third, it’s possible that some who have worked in front-line service jobs have used their time during COVID to consider alternate careers, especially those who viewed jobs at restaurants or retail as temporary work. Finally, the government has stepped up with more generous unemployment benefits, which have allowed workers to remain financially secure over the past year and perhaps not feel an urgent need to return to work just yet.
Locally, some businesses here in University City are facing these same challenges. At UCD, we’ve put together a list of some of these opportunities on our blog. For those looking to get back to work, there are plenty of businesses that would love to hear from you!
| Weekly Postings, Jan. 24th – Jan 30th | Percentage Change from Feb 15th 2020 | Weekly Change | |||
Industry | Phila Suburbs | Phila City | Phila Metro | Phila City | Phila Metro | Phila City |
Health Care & Social Assistance | 2140 | 802 | -21% | -37% | 8% | 4% |
Professional, Scientific & Tech Services | 577 | 609 | -39% | -9% | -11% | -11% |
Retail Trade | 1199 | 175 | -9% | -33% | -2% | 2% |
Finance & Insurance | 963 | 711 | 5% | 36% | 23% | 147% |
Accommodation & Food Service | 1062 | 342 | 100% | -40% | 10% | -19% |
Manufacturing | 888 | 182 | -19% | -23% | -3% | 10% |
Administrative & Support & Waste Mgmt | 615 | 148 | -10% | -35% | -6% | -15% |
Educational Services | 257 | 244 | -60% | -51% | -25% | 33% |
Transportation & Warehousing | 472 | 137 | -17% | -22% | 13% | 10% |
Information | 184 | 158 | -23% | -51% | 22% | -2% |
Other Services | 304 | 82 | -23% | 8% | 13% | -5% |
Public Administration | 209 | 100 | 41% | -20% | 15% | -12% |
Real Estate & Rental Leasing | 193 | 84 | -8% | -33% | 4% | 9% |
Construction | 179 | 58 | 27% | -30% | -20% | -2% |
Arts, Entertainment & Recreation | 148 | 76 | 72% | 25% | 35% | 192% |
Wholesale Trade | 77 | 4 | 15% | -60% | -17% | -60% |
Utilities | 35 | 10 | -15% | 25% | -53% | 100% |
Mining, Quarrying and Oil & Gas | 28 | 14 | 0% | 27% | 8% | 8% |
Mgmt of Companies & Enterprises | 14 | 8 | -58% | -27% | -18% | 300% |
Agriculture, Forestry & Hunting | 22 | 4 | 47% | -20% | 38% | -43% |
Unspecified | 2836 | 1300 | -8% | -26% | -20% | 63% |
Total | 12402 | 5248 | -10.8% | -25.2% | -3.4% | 21.0% |
About the data: Data is sourced from Burning Glass Technologies Labor Insights, unless otherwise noted, covering job postings in the City of Philadelphia and the Philadelphia Metro Statistical Area (MSA), which is comprised of roughly a circle surrounding Trenton, Philadelphia, King of Prussia, Camden, and Wilmington. This data is then compared to a benchmark week of February 9th – 15th, which was the last week before the economic impact of COVID-19 began to be reflected in job posting data.