Every week, we will be publishing labor market industry (LMI) data and important trends to consider in the development of an equitable economic recovery from the COVID-19 crisis. We are always looking for opportunities to learn, grow, and collaborate. Email wpsi@universitycity.org to learn more.
It has been a dismal few months for those looking for jobs. Even in industries deemed essential, opportunities have declined steeply and are only now beginning to inch back toward pre-COVID levels. However, the impacts of the weekly job declines have varied greatly by industry.
Let’s look at three of the largest industries in the Philadelphia region: Retail, Health Care & Social Assistance, and Hospitality (Classified as “Accommodations and Food Service”). All three saw steep declines, despite all serving some essential functions, with postings down in the past months as much as 40% for Retail, 55% for Health Care, and 65% for Hospitality. However, the week by week changes varied dramatically. Healthcare job postings followed a gentle curve, dipping as non-essential procedures were cancelled and rising as restrictions loosen. Hospitality has been more volatile, with the biggest overall declines, but a surprising peak almost back to pre-COVID levels in late March. Looking back to the week of March 21st, we find that the job postings driving that growth came almost exclusively from a massive spike in ads for delivery drivers, from companies like Door Dash and Postmates. Makes sense, right?
However, variations in Hospitality job postings are nothing compared to Retail. During the last week of March, there were 48% more jobs posted in the retail sector than in the pre-COVID baseline week. Despite plunging back down in the following weeks, a second spike occurred on April 18th, with 28% more jobs than the baseline. This happened a third time last week, with 49% more retail job postings than there were the week ending February 15th. Anyone want to guess what might have caused this?
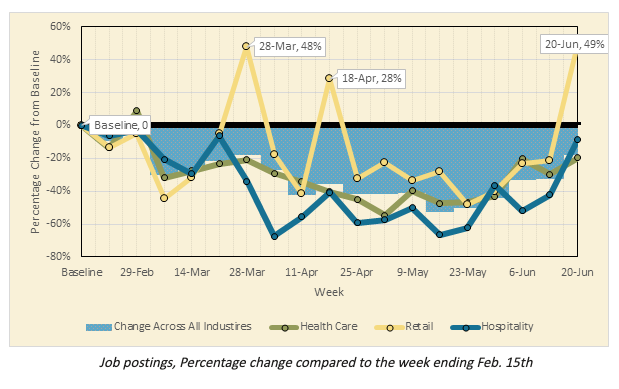
If you guessed Amazon, you’d be correct. Buried in all the news of the past few months was a story about Amazon looking to hire over 100,000 workers. The spikes we see in retail job postings locally are due almost exclusively to that. Amazon posted over 1,000 jobs in the Philadelphia area this week and in the week ending March 28th. Another 600 jobs were added in mid-April, driving the increases in retail postings. Whether these jobs remain in the post-COVID world – and the effect this has on small and medium sized brick and mortar retailers – remains to be seen. But just like so many of us have come to rely on Amazon to deliver us essential products during the last few months, our economy is increasingly relying on Amazon to bolster our labor market.
Across industries, job postings continued to pick back up, as counties begin to reopen. While this is good news for those seeking employment, most opportunities continue to be in low wage sectors like retail and food service, which will see shutdowns again if/when COVID-19 cases start to rise.
Industry, 2-digit NAICS code | This Week | Change from baseline (Feb 15th) | Chance from prior week (June 13th) | |||
| Phila Metro | Phila City | Phila Metro | Phila City | Phila Metro | Phila City |
Health Care & Social Asst. (62) | 3181 | 1075 | -26% | -26% | 14% | 19% |
Prof, Scientific and Tech Services (54) | 1043 | 430 | -25% | -31% | 5% | -6% |
Retail Trade (44-45) | 2363 | 234 | 57% | 26% | 90% | 35% |
Finance & Insurance (52) | 949 | 270 | -30% | -32% | -4% | -25% |
Accommodation & Food (72) | 1013 | 257 | -6% | -33% | 59% | 35% |
Manufacturing (31-33) | 942 | 207 | -20% | -3% | 13% | -6% |
Admin, Support, Waste MGMT, Remediation (56) | 699 | 167 | -29% | -22% | 0% | -12% |
Educational Services (61) | 569 | 220 | -32% | -40% | 47% | 20% |
Transportation & Warehousing (48-49) | 459 | 170 | -40% | 56% | 10% | 40% |
Information (51) | 244 | 72 | -51% | -63% | 5% | -6% |
Other Services (81) | 350 | 63 | -37% | -11% | 50% | 15% |
Public Admin (92) | 273 | 87 | -23% | -40% | 5% | -19% |
Real Estate & Rental Leasing (53) | 388 | 110 | 39% | 3% | 29% | -4% |
Construction (23) | 312 | 91 | -9% | 86% | 66% | 160% |
Arts, Entertainment & Recreation (71) | 127 | 44 | -27% | 10% | 4% | 42% |
Wholesale Trade (42) | 48 | 6 | -40% | -57% | -24% | -33% |
Utilities (22) | 38 | 9 | 12% | -18% | 12% | 80% |
Mining, Quarrying, Oil & Gas Extraction (21) | 19 | 3 | -34% | -57% | -50% | -75% |
Management, Companies & Enterprises (55) | 29 | 7 | 81% | 40% | 26% | -22% |
Agriculture, Forestry, Fishing and Hunting (11) | 13 | 3 | -52% | -57% | -13% | -25% |
Unspecified | 4229 | 1455 | -9% | -2% | 13% | 17% |
Total | 17288 | 4980 | -16% | -18% | 22% | 11% |
About the data: Data is sourced from Burning Glass Technologies Labor Insights, unless otherwise noted, covering job postings in the City of Philadelphia and the Philadelphia Metro Statistical Area (MSA), which is comprised of roughly a circle surrounding Trenton, Philadelphia, King of Prussia, Camden, and Wilmington. This data is then compared to a benchmark week of February 9th – 15th, which was the last week before the economic impact of COVID-19 began to be reflected in job posting data.